Computing functional connectivity.
Overview
Teaching: 20 min
Exercises: 20 minQuestions
What is functional connectivity?
How can I compute functional connectivity between regions with R?
Objectives
Being able to extract time series from an atlas.
Recap: what is functional connectivity?
Before, we’ve worked with brain scans of subjects while they are performing specific tasks. However, another field of research within neuroimaging is about what the brain does during rest. It has been shown to be a valuable source to figure out how the brain is logically organised, and how the parts of the brain communicate with each other.
One interesting line of research is about creating atlases, where the brain is divided into different parts, for example using unsupervised learning (for example principle components analysis). Another research is about finding the ‘functional’ connections between those parts, for example by looking at the correlations between the average signal in those brain parcels.
Let’s load the necessary libraries
library(RColorBrewer)
library(scales)
library(lattice)
library(Rcmdr)
Extracting time series data
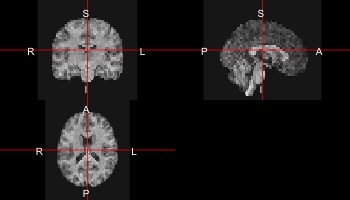
Let’s look at the anatomical data for our first subject.
sub10159_anat <- readnii("sub-10159/sub-10159_T1w_space-MNI152NLin2009cAsym_preproc_reduced.nii.gz")
ortho2(sub10159_anat)
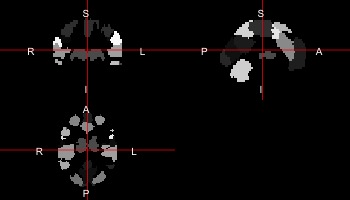
And this is an atlas. Note that this is not the original atlas, but a low-resolution version to work with in this course. If you want the original atlas: https://team.inria.fr/parietal/18-2/spatial_patterns/spatial-patterns-in-resting-state/
atlas <- readnii("MSDL_rois/msdl_rois_reduced_reshaped.nii")
ortho2(atlas)
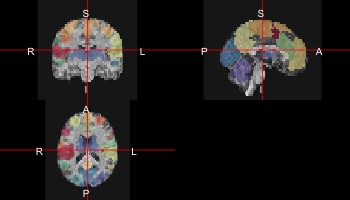
With a few extra plotting functions using colorbrewer and the scales library, we can create a cool overlay of the atlas on the anatomical scan:
rf <- colorRampPalette(rev(brewer.pal(11,'Spectral')))
cols <- rf(39)

ortho2(sub10159_anat,atlas,col.y=alpha(sample(cols),0.5))
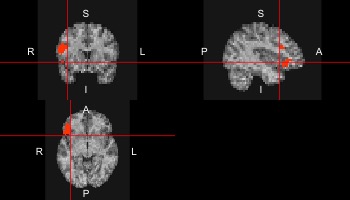
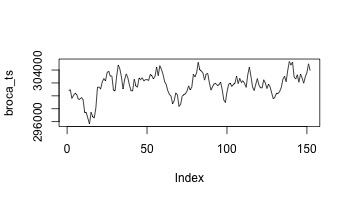
Now we want to extract a certain brain region, for example BROCA from the resting state data.
broca <- ifelse(atlas==29,1,0)
ortho2(sub10159_anat,broca,xyz=c(20,50,19))
broca_mask <- array(rep(broca,152),dim=c(65,77,49,152))
broca_ts <- apply(data*broca_mask,4,sum)
plot(broca_ts,type='l')
Let’s write a function to do this:
extract_signal <- function(data,atlas,mask_id){
  mask <- ifelse(atlas==mask_id,1,0)
  expand_mask <- array(rep(mask,152),dim=c(65,77,49,152))
  data_masked <- data*expand_mask
  timeseries <- apply(data_masked,4,sum)
  timeseries <- (timeseries - mean(timeseries))/sd(timeseries)
  timeseries
}
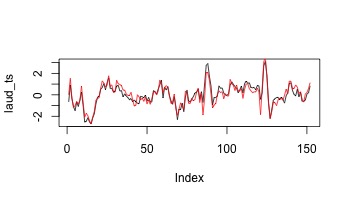
laud_ts <- extract_signal(data,atlas,1)
plot(laud_ts,type="l")
raud_ts <- extract_signal(data,atlas,2)
lines(raud_ts,col=2)
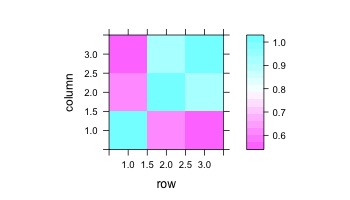
together = matrix(c(broca_ts,laud_ts,raud_ts),ncol=3)
correlations = cor(together)
levelplot(correlations)
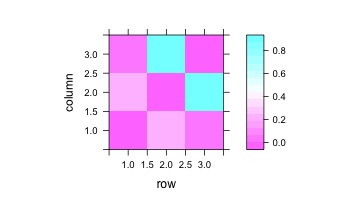
estimate <- partial.cor(together,tests=TRUE)
levelplot(estimate$R)
confounders <- read.table("sub-10159/sub-10159_task-rest_bold_confounds.tsv",skip=2)
fd <- confounders$V6
fd <- (fd-mean(fd))/sd(fd)
# there is no value for the fd on the first timepoint --> set to 0
fd <- c(0,fd)
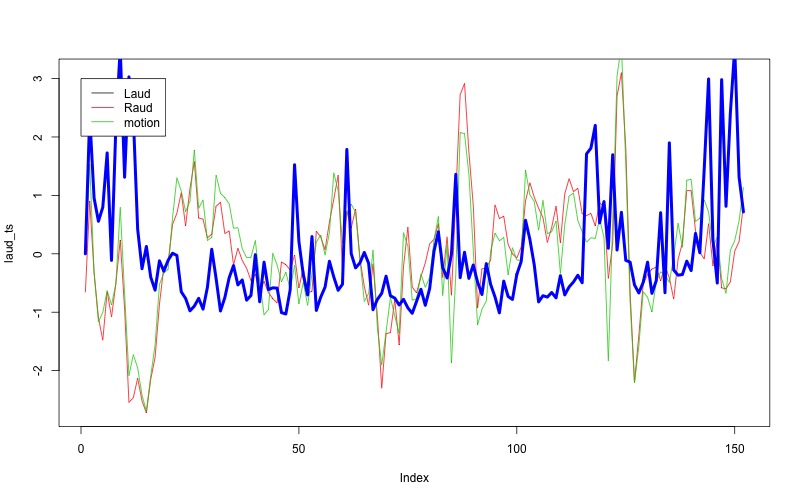
plot(laud_ts,type="l")
lines(raud_ts,col=2)
lines(fd,col=3,lwd=3)
legend(-1.5,c("L Aud","R Aud","FD"),col=1:3,lty=1,cex=0.5)
Exercises
Can you extract the timeseries in subject 10365 for the different parts of the DMN. The atlas labels are: (4, Left DMN); (5, Median DMN); (6, Frontal DMN); (7, Right DMN)? Also try the following:
- plot the time series together with the framewise displacement
- what are the correlations
- what happens if you add the motion to the time series when computing the partial correlations?
Advanced
- Can you regress out the motion from the time series?
- Can you regress out all motion parameters from the time series?
- What happens with the correlations?
- Can you extract (using a loop) the time series for all parts of the atlas?
- Plot the correlation matrix and the partial correlation matrix.
Key Points
Using an atlas, we can extract time series data from a resting state fMRI.
Using those time series, we can estimate the functional connectivity (correlation) between parts of the brain.